
Storms and Signals
Dear Clients and Friends,
Our annual dinner was on January 29th, and our keynote speaker was Dan Clifton from Strategas. A replay link to the presentation can be found here.
For the first quarter the S&P 500 was down 4.3% and the Nasdaq was down over 7%. In our view, two distinct forces drove the decline: early-year fears about AI disruption in the software sector, followed by the war with Iran and the closure of the Strait of Hormuz. The Strait of Hormuz carries roughly 20% of the world’s seaborne crude and liquefied natural gas (LNG). Its closure had sent Brent crude surging toward $120 per barrel, gas prices across the US to over $4 per gallon, and lowered the prospect of Federal Reserve rate cuts this year. We believe higher energy prices are deeply inflationary, crowd out spending elsewhere, and squeeze corporate margins. We have seen airlines reduce flight schedules, companies add fuel surcharges, and consumers pull back. Iran’s strike on Qatar’s Ras Laffan LNG facility has also taken roughly 17% of Qatar’s LNG export capacity offline - potentially for years - adding a longer-term dimension to this disruption.
On April 7th a ceasefire was announced. We don’t know how the situation will be resolved, but the Trump administration has a number of reasons to make the ceasefire hold. The US can claim to achieve its main objectives of degrading Iran’s military and setting back their nuclear program. We observed that the US economy was beginning to come under pressure from higher energy prices. Bipartisan support for the war seems to be waning. Finally, midterms are quickly approaching, and Republican numbers have been deteriorating. Meanwhile, we think markets have turned the corner for now as it appears the risk of the worst case economic scenario is off the table.
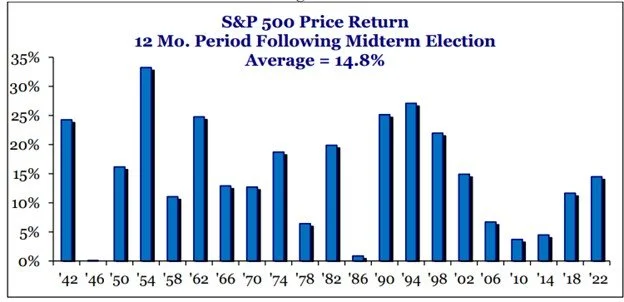
2026 is a Midterm Election year, and in these years the market tends to sell off at some point before the election. The good news is that since 1942 the market has been up in every 12 month period following the Midterms. Eventually, this trend may be broken, but for now it is something to be aware of as seen in the chart below.
The Magnificent 7 are all great companies and they comprise 35% of S&P 500 index. For the past several years, no effective alternative seems to have emerged. As a result, it is likely that most investors are significantly over indexed to a narrow group of holdings, which may leave those portfolios more vulnerable to periods of rotation. The Magnificent 7 have been great investments over the last 10 years, but we expect that there will be better investment returns elsewhere over the next 10 years. The chart below highlights how one sided the market has been for the last 3 years. In our view this has developed into a trend since the great financial crisis, but we believe 2026 will most likely mark the peak.
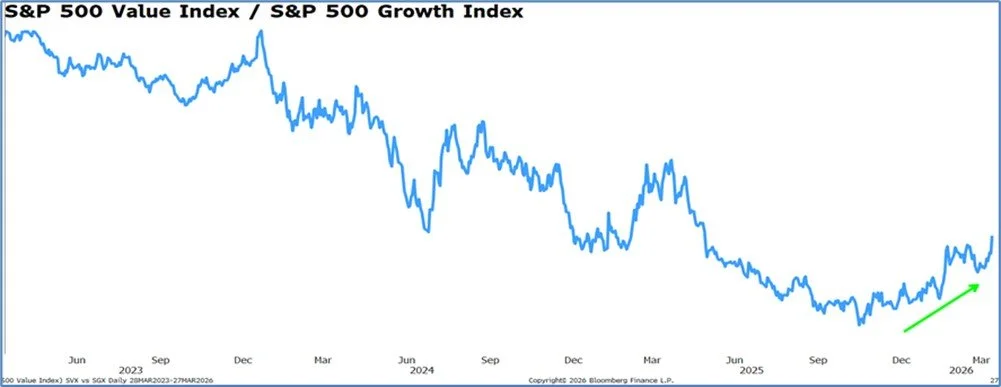
We believe the market is poised to have greater participation beyond the largest stocks, and we are now seeing this play out. Small Caps, Mid Caps, and International stocks have generally underperformed the S&P 500 for a long time, but we have noticed a change in 2026. Year to date, we have witnessed these sectors outperform both the Magnificent 7 and the S&P 500, and we think there is a good chance that this trend can go on for a while. There is over $40 trillion dollars benchmarked to the S&P 500 Index and Nasdaq. This money could flow into other stocks if performance improves outside of the largest names.
The other major theme of the quarter was AI disruption. Progress on AI continues to increase at a rapid rate. In addition to looking for companies that will benefit from AI, we are trying to avoid investments that could be negatively impacted by AI. Our portfolio turnover has been above average over the past year as we have selectively exited long-held positions, namely software stocks, where we believe AI poses a genuine threat to the underlying business model.
In the meantime we continue to focus on investments in companies that we believe have a bright future, unique assets, and strong management teams.
Below we wanted to highlight our recent investments Postal Realty Trust (PSTL) and Grupo Aeroportuario del Centro Norte (OMAB), which we purchased in our Friedberg Equity Income Strategy. Postal Realty Trust is a small cap REIT with a 5% dividend yield. OMAB is an international stock that owns airports geared towards business travel. We believe OMAB should benefit from growth between the US and Mexico.
Postal Realty Trust (PSTL)
Postal Realty Trust is a small cap REIT that owns US Post Offices. They currently own just under 1,900 locations across the U.S. with an annualized base rent of $81M. The portfolio is a mix of 54% Flex locations (think large USPS stores), 23% Last-Mile (think tiny USPS stores in your neighborhood), and 23% Industrial (large USPS distribution/processing centers).

They are the first and only public REIT focused on USPS leased properties. We believe this is a classic niche consolidation play. There are ~31K USPS facilities, of that ~23K are leased and ~8.5K owned by the USPS. PSTL is buying post offices from small private owners. The USPS is likely to be as safe and stable of a tenant base as you can have.
The portfolio is 99.8% occupied with an average of 4-year lease terms and 3% rent escalators. The runway to buy more post offices appears to be vast and will feed their growth pipeline for years.
USPS itself has undergone a structural turnaround with the goal to improve service reliability, stabilize their finances, and shift toward package logistics given the decline of letter-mail volume share decline vs. packaging. The USPS is in the process of opening 300 new sorting & distribution centers over the next few years to improve delivery operations.
PSTL is a founder-led REIT that we believe holds genuine niche expertise. Founder and CEO Andrew Spodek has decades of experience. We think the stock is attractive as it’s trading under 15x Funds From Operations and has a 5% dividend yield.
Grupo Aeroportuario del Centro Norte (OMAB)
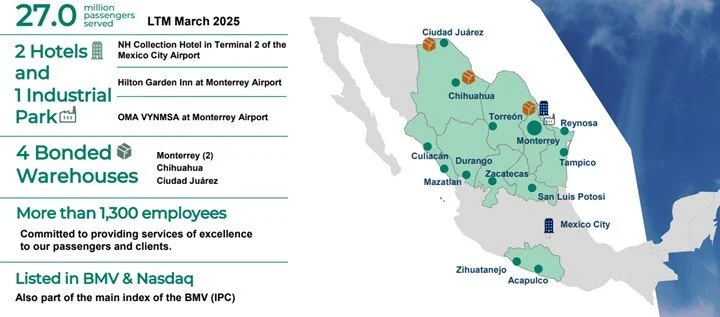
OMAB is one of three publicly traded airport operators in Mexico. They operate 13 international airports under long-dated concessions (50-year term into 2048). They make money from regulated air travel services (passenger charges, landing/parking, etc.) and higher-margin commercial activities (parking, food & beverage, retail, lounges, cargo/logistics). They are levered directly to passenger volumes and tariff settings. The network is heavily concentrated in Monterrey, Mexico which is over 40% of the total mix. Every 5 years, OMAB and the Mexican government negotiate via a Master Development Program (MDP) for the next 5-years. The MDP is a capex mandate to the operator. This requires them to expand terminals, improve runways/taxiways, and add equipment.
Monterrey and the broader North/Central industrial corridor is where the bulk of near shoring appears to be happening. The core bet is that these regions will continue to share in manufacturing investment and supply chain reconfiguration, which may translate into durable business travel and cargo activity. We anticipate leisure travel will stay consistent. We expect Mexico’s integration with the US to deepen further. AB Volvo increased its planned investment in a new Nuevo Leon truck plant to $1B with production scheduled to start in 2026. This is exactly the kind of capex cycle that is likely to support sustained corporate travel and air-cargo needs around Monterrey. OMAB also launched 13 new domestic and 5 new international routes. There was also notable growth in retail (+20%), restaurants (+22%) and VIP lounges (+30%) in 2025.
The biggest regulatory overhang is now over with OMAB having entered into the new 2026-2030 MDP. Investors have been wary since the 2023 regulatory turbulence where the Mexican government forced a concession rate hike on operators from 5% to 9%. Fortunately, OMAB was able to offset the margin hit with continued traffic momentum. The stock trades for about 15X earnings and has a dividend yield of 3.8%
We are always happy to answer any questions you may have so please feel free to email, call, or come into the office to see us.
Sincerely,
Jonathan, Mark, Gabe and David
This quarterly update is being furnished by Brasada Capital Management, LP (“Brasada”) on a confidential basis and is intended solely for the use of the person to whom it is provided. It may not be modified, reproduced or redistributed in whole or in part without the prior written consent of Brasada. This document does not constitute an offer, solicitation or recommendation to sell or an offer to buy any securities, investment products or investment advisory services or to participate in any trading strategy.
The net performance results are stated net of all management fees and expenses and are estimated and unaudited. These returns reflect the reinvestment of any dividends and interest and include returns on any uninvested cash. In addition to management fees, the managed accounts will also bear its share of expenses and fees charged by underlying investments. The fees deducted herein represent the highest fee incurred by any managed account during the relevant period. Past performance is no guarantee of future results. Certain market and economic events having a positive impact on performance may not repeat themselves. The actual performance results experienced by an investor may vary significantly from the results shown or contemplated for a number of reasons, including, without limitation, changes in economic and market conditions.
References to indices or benchmarks are for informational and general comparative purposes only. There are significant differences between such indices and the investment program of the managed accounts. The managed accounts do not necessarily invest in all or any significant portion of the securities, industries or strategies represented by such indices and performance calculation may not be entirely comparable. Indices are unmanaged and have no fees or expenses. An investment cannot be made directly in an index and such index may reinvest dividends and income. References to indices do not suggest that the managed accounts will, or is likely to achieve returns, volatility or other results similar to such indices. Accordingly, comparing results shown to those of an index or
benchmark are subject to inherent limitations and may be of limited use.
Certain information contained herein constitutes forward looking statements and projections that are based on the current beliefs and assumptions of Brasada and on information currently available that Brasada believes to be reasonable. However, such statements necessarily involve risks, uncertainties and assumptions, and prospective investors may not put undue reliance on any of these statements. Due to various risks and uncertainties, actual events or results or the actual performance of any entity or transaction may differ materially from those reflected or contemplated in such forward-looking statements. The information contained herein is believed to be reliable but no representation, warranty or undertaking, expressed or implied, is given to the accuracy or completeness of such information by Brasada.